Flowfield Visualization#
qlbm uses vtk and Paraview for visualization. While we generally recommend Paraview for detailed analysis, the script below can parse vtk files and output gifs for a convenient alternative.
[1]:
from os import listdir
from os.path import isdir

import imageio
import numpy as np
import pyvista as pv
from PIL import Image, ImageDraw
from pyvista import themes

pv.set_plot_theme(themes.ParaViewTheme())
[2]:
# Function to create the animation
def create_animation(simdir, output_filename):
    vti_files = sorted(
        [f"{simdir}/{fname}" for fname in listdir(simdir) if fname.endswith(".vti")]
    )
    stl_mesh = pv.read(
        [f"{simdir}/{fname}" for fname in listdir(simdir) if fname.endswith(".stl")]
    )

    # Find the global maximum scalar value
    max_scalar = 0
    for vti_file in vti_files:
        mesh = pv.read(vti_file)
        if mesh.active_scalars is not None:
            max_scalar = max(max_scalar, mesh.active_scalars.max())

    images = []
    sargs = dict(
        title="Measurements at gridpoint",
        title_font_size=20,
        label_font_size=16,
        shadow=True,
        n_labels=3,
        italic=True,
        fmt="%.1f",
        font_family="arial",
        position_x=0.2,  # Centering the scalar bar
        position_y=0.05,
    )

    images = []
    for c, vti_file in enumerate(vti_files):
        time_step_mesh = pv.read(vti_file)

        plotter = pv.Plotter(off_screen=True)
        plotter.add_mesh(
            time_step_mesh,
            clim=[0, max_scalar],
            show_edges=True,
            scalar_bar_args=sargs,
        )

        plotter.add_mesh(
            stl_mesh,
            show_scalar_bar=False,
        )
        plotter.view_xy()
        img = plotter.screenshot(
            transparent_background=True,
        )
        images.append(img)

        # Clean up the plotter
        plotter.close()

        # Convert screenshot to PIL image
        pil_img = Image.fromarray(img)
        draw = ImageDraw.Draw(pil_img)

        # Draw progress bar
        bar_width = int(pil_img.width * 0.8)
        bar_height = 20
        bar_x = (pil_img.width - bar_width) // 2
        bar_y = pil_img.height - 40
        progress = int((c + 1) / (len(vti_files)) * bar_width)

        draw.rectangle(
            [bar_x, bar_y, bar_x + bar_width, bar_y + bar_height],
            outline="black",
            width=3,
        )
        draw.rectangle(
            [bar_x, bar_y, bar_x + progress, bar_y + bar_height], fill="purple"
        )

        images.append(np.array(pil_img))

    # Create the GIF from the collected images
    imageio.mimsave(output_filename, images, duration=1, loop=0)
We ship the data below with the GitHub repository, but custom data can be generated using the scripts provided in the demos/simulation directory.
[3]:
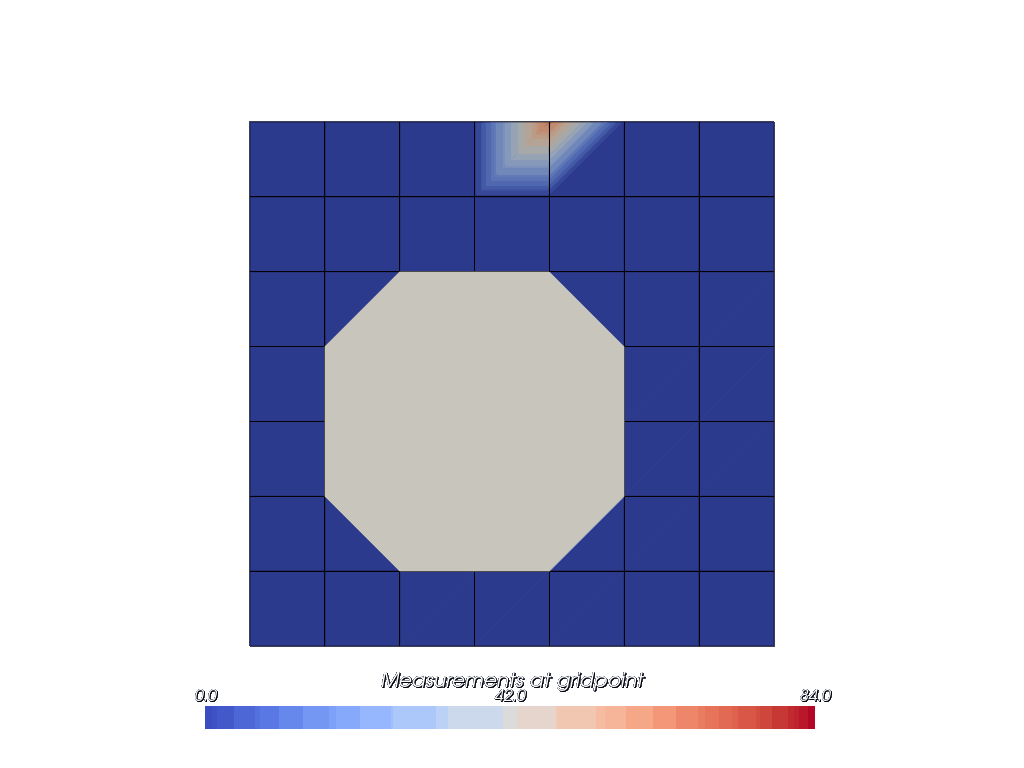
# 2D CQLBM visualization with 7 obstacles and mixed boundary conditions
simdir = "sample-flowfield/collisionless-eight"

# Required for this to work on the website
if not isdir(simdir):
    simdir = "../../../../demos/visualization/" + simdir

create_animation(f"{simdir}/paraview", "cqlbm_figure_eight.gif")
2026-05-12 23:00:12.958 ( 0.738s) [ 7F2AEA0A0B80]vtkXOpenGLRenderWindow.:1460 WARN| bad X server connection. DISPLAY=
For a better visualization experience, we recommend visualizing the results in Paraview.
[ ]:
[4]:
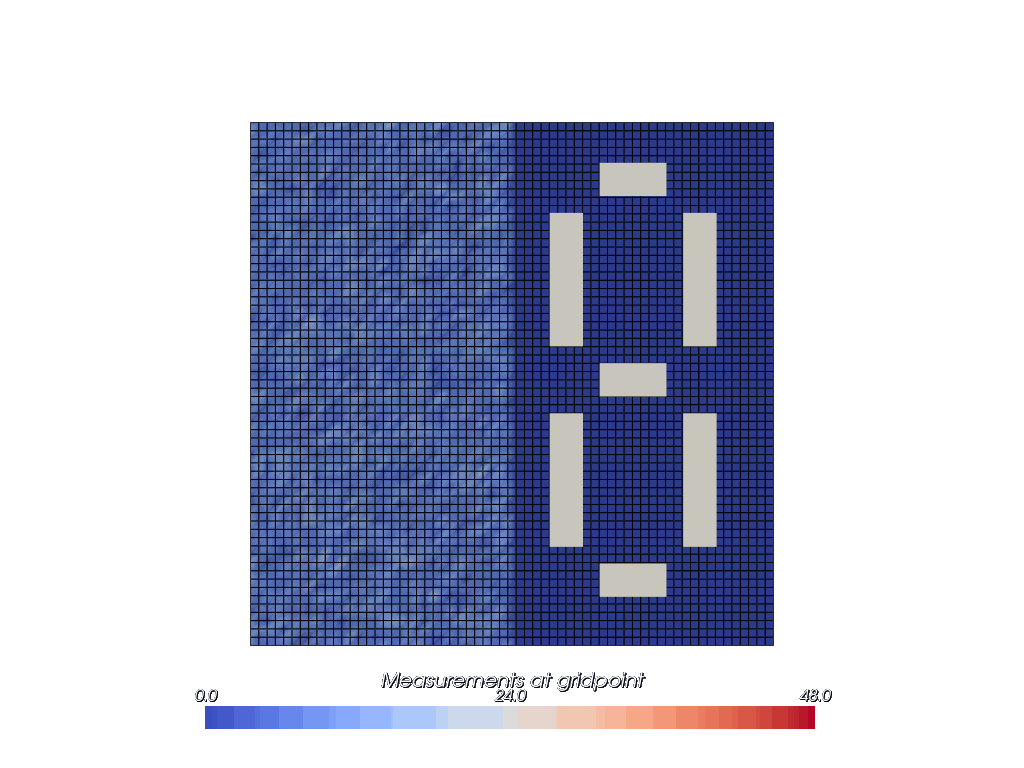
# 2D STQLBM visualization with a circle obstacle
simdir = "sample-flowfield/spacetime-d2q4-8x8-circle"

# Required for this to work on the website
if not isdir(simdir):
    simdir = "../../../../demos/visualization/" + simdir


create_animation(f"{simdir}/paraview", "stqlbm_circle.gif")